Every so often, I see questions where a guy or girl is asking if he or she is considered "short" or "tall". I also see that many seeem to have misconceptions as to what is really average, and some people will be coming in with an above average height and think they're short, when in reality, unless it's their location, the reason for that is media brainwashing and confirmation bias.
Let's get to the actual facts and statistics.
Mean
Men: 69.3 inches
Women: 64.1 inches
(This data is for persons between the age of 20 and 29.)
Standard Deviation
Men: 2.92 inches
Women: 2.75 inches
What is "Standard Deviation"?
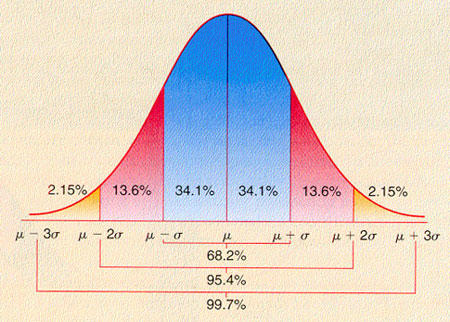
The standard deviation gives us information about the "spread" of a distribution. This is espeically useful information to know for a distribution that is "normal", meaning data that represents a symmetrical bell-shaped graph.
So in this case, let's take men's height for example. One standard deviation is 2.92 inches. This means that a height of 72.22 inches is exactly one standard deviation above the mean, while a height of 66.38 inches is exactly one standard deviation below. To find the value of a data point s standard deviations above/below the mean, you simply do the mean, 69.3, plus/minus 2.92s (in this example - male height in the United States).
In a normal distribution, 68.26894809% of the data falls between one standard deviation below the mean and one standard deviation above. 95.4499876% of the data falls betwen two standard deviations below the mean and two standard deviations above. 99.73000656% of the data falls between three standard deviations below the mean and three standard deviations above.
What can we gather from this?
~68% of men's height in the United States must fall between 66.38 and 72.22 inches.
~68% of women's height in the United States must fall between 61.35 and 66.35 inches.
Now we'll look at a range of heights, and find their z-scores and percentiles.
For this, I also want to introduce another term, z-score. A z-score simply indicates how many standard deviations above or below the mean a data point is. A z-score of -1 for a data point means it is one standard deviation below the mean and a z-score of -1 means it is one standard deviation above.
Men's Height
5 feet 0 inches | z-score = -3.185 | 0.072 percentile
5 feet 1 inches | z-score = -2.842 | 0.224 percentile
5 feet 2 inches | z-score = -2.500 | 0.621 percentile
5 feet 3 inches | z-score = -2.158 | 1.548 percentile
5 feet 4 inches | z-score = -1.815 | 3.475 percentile
5 feet 5 inches | z-score = -1.473 | 7.043 percentile
5 feet 6 inches | z-score = -1.130 | 12.922 percentile
5 feet 7 inches | z-score = -0.788 | 21.544 percentile
5 feet 8 inches | z-score = -0.445 | 32.809 percentile
5 feet 9 inches | z-score = -0.103 | 45.910 percentile
5 feet 10 inches | z-score = 0.240 | 59.472 percentile
5 feet 11 inches | z-score = 0.582 | 71.978 percentile
6 feet 0 inches | z-score = 0.925 | 82.244 percentile
6 feet 1 inches | z-score = 1.267 | 89.744 percentile
6 feet 2 inches | z-score = 1.610 | 94.625 percentile
6 feet 3 inches | z-score = 1.952 | 97.454 percentile
6 feet 4 inches | z-score = 2.295 | 98.912 percentile
6 feet 5 inches | z-score = 2.637 | 99.582 percentile
6 feet 6 inches | z-score = 2.979 | 99.856 percentile
6 feet 7 inches | z-score = 3.322 | 99.955 percentile
6 feet 8 inches | z-score = 3.664 | 99.988 percentile
Women's Height
4 feet 6 inches | z-score = -3.673 | 0.012 percentile
4 feet 7 inches | z-score = -3.309 | 0.047 percentile
4 feet 8 inches | z-score = -2.945 | 0.161 percentile
4 feet 9 inches | z-score = -2.582 | 0.491 percentile
4 feet 10 inches | z-score = -2.218 | 1.327 percentile
4 feet 11 inches | z-score = -1.854 | 3.183 percentile
5 feet 0 inches | z-score = -1.491 | 6.799 percentile
5 feet 1 inches | z-score = -1.127 | 12.981 percentile
5 feet 2 inches | z-score = -0.764 | 22.255 percentile
5 feet 3 inches | z-score = -0.400 | 34.458 percentile
5 feet 4 inches | z-score = -0.036 | 48.548 percentile
5 feet 5 inches | z-score = 0.327 | 62.828 percentile
5 feet 6 inches | z-score = 0.691 | 75.519 percentile
5 feet 7 inches | z-score = 1.055 | 85.428 percentile
5 feet 8 inches | z-score = 1.418 | 92.192 percentile
5 feet 9 inches | z-score = 1.782 | 96.261 percentile
5 feet 10 inches | z-score = 2.145 | 98.402 percentile
5 feet 11 inches | z-score = 2.509 | 99.395 percentile
6 feet 0 inches | z-score = 2.873 | 99.797 percentile
6 feet 1 inches | z-score = 3.236 | 99.940 percentile
6 feet 2 inches | z-score = 3.600 | 99.984 percentile
Conclusion
This may demonstrate the illusions about height society and the media impose on us. Many people will feel as if they're "too short" or "too tall" even when their height is actually quite normal. A man 5'9, will probably feel "short", even though he's taller than over 45% of men in the United States, simply due to fact that the media, societal pressure, and the resulting confirmation bias leads to the "6'0 is the average height for men" mentality, whereas as we can, that is far from the truth. 6'0 in actuality is almost one whole standard deviation above the mean and is around at the 82 percentile. Same goes for women. A woman 5'4 may feel short because from what I've seen, society tends to feel as if 5'6 is the mean height for women. In actuality, as we can see from the table above, 5'6 is quite tall - taller than over 75% of the women in the United States. Again, this data is for grown men and women between the ages of 20 and 29.
This makes the fact that a data point within two standard deviations of the mean is not considered "unusual". That means a man can be as short as 5'4 or as tall as 6'3 according to the above data, and that's not considered statisticallly "unusual". A woman can be as short as 4'11 or as tall as 5'9 and still not be considered statistically "unusual". These numbers are rounded, so for a more accurate analysis, please refer to the table above again.
Again, the men's height range that is not considered statistically unusual is especially surprising, and the fact that it does again demonstrates the potency of our confirmation bias as a society - how inflated our sense of average is.
Anyway, the purpose of this myTake was to provide those who are curious about where they fall or those who are feeling insecure about their height, to see where they fall and their percentile in terms of height.
Most Helpful Opinions