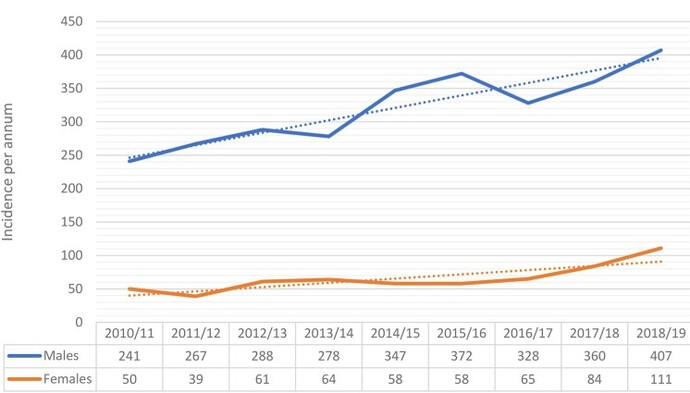
It costs the British National Health Service over £338,819 a year and 85% of patients are male. The problem is getting worse every year, but what is it. The graph is from the annals of the royal college of surgeons, but what does it show?
Answer and link on Sunday
Drunk people trying to fly on broomstick at Halloween
Removal of objects stuck in rectums
Knife wounds from pumpkin carving
Genital burns from climbing over electric fences
Chemical burns from thinking toilet wipes are for wiping your bottom
Something else
Select gender and age to cast your vote:
Please select your age
Updates
9 mo
Well done if you guessed hospital admissions for things stuck up bums https//publishing. rcseng. ac. uk/doi/10.1308/rcsann.2020.7129 remember to always tell a friend before playing hide the hairbrush
It seems like the graph might be illustrating statistics related to an injury or medical condition that predominantly affects males and is increasing in prevalence, thus costing the NHS significantly. Without the image, but considering the expense and gender specifics, it might relate to accidents or conditions like motorcycle injuries or sports-related accidents. However, precise identification requires more information.
 Girl's Behavior
  Guy's Behavior
  Flirting
  Dating
  Relationships
  Fashion & Beauty
  Health & Fitness
  Marriage & Weddings
  Shopping & Gifts
  Technology & Internet
  Break Up & Divorce
  Education & Career
  Entertainment & Arts
  Family & Friends
  Food & Beverage
  Hobbies & Leisure
  Other
Other  Religion & Spirituality
  Society & Politics
  Sports
  Travel
  Trending & News