 Girl's Behavior
  Guy's Behavior
  Flirting
  Dating
  Relationships
  Fashion & Beauty
  Health & Fitness
  Marriage & Weddings
  Shopping & Gifts
  Technology & Internet
  Break Up & Divorce
  Education & Career
  Entertainment & Arts
  Family & Friends
  Food & Beverage
  Hobbies & Leisure
  Other
Other  Religion & Spirituality
  Society & Politics
  Sports
  Travel
  Trending & News
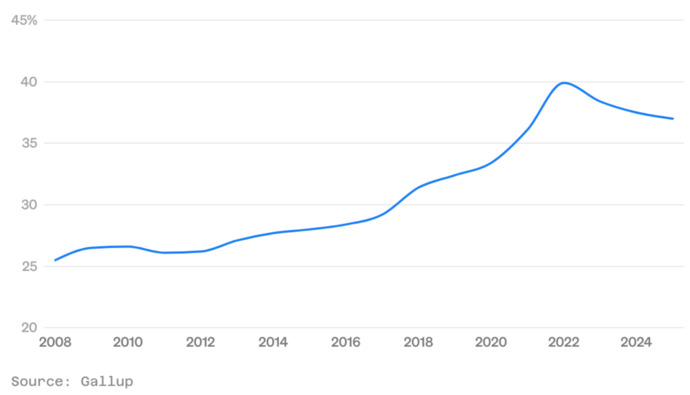
Now that October is reaching an end...
Here's an interesting question.
What is this a graph of of? What does it show?
Make your best guess.
Correct answer will be given in a few days (Sunday).
Updates
8 mo
Several very interesting guesses. Thank you.
This graph shows the percentage of overweight Americans.
The decline since 2022 is not because people are eating healthier, it's the increased use of weight loss drugs.
This graph shows the percentage of overweight Americans.
The decline since 2022 is not because people are eating healthier, it's the increased use of weight loss drugs.
Updates
8 mo
Since no one guessed what the graph is, I'm awarding MHO to the most creative guesses for guys and girls.

Most Helpful Opinions