 Girl's Behavior
 Guy's Behavior
 Flirting
 Dating
 Relationships
 Fashion & Beauty
 Health & Fitness
 Marriage & Weddings
 Shopping & Gifts
 Technology & Internet
 Break Up & Divorce
 Education & Career
 Entertainment & Arts
 Family & Friends
 Food & Beverage
 Hobbies & Leisure
 Other
 Religion & Spirituality
 Society & Politics
 Sports
 Travel
 Trending & News




A LOT
A LITTLE
NONE AT ALL
NOT SURE
Select gender and age to cast your vote:
Please select your age
A total of 60 votes were cast: 21 girls and 39 guys. See detailed results
Poll Result
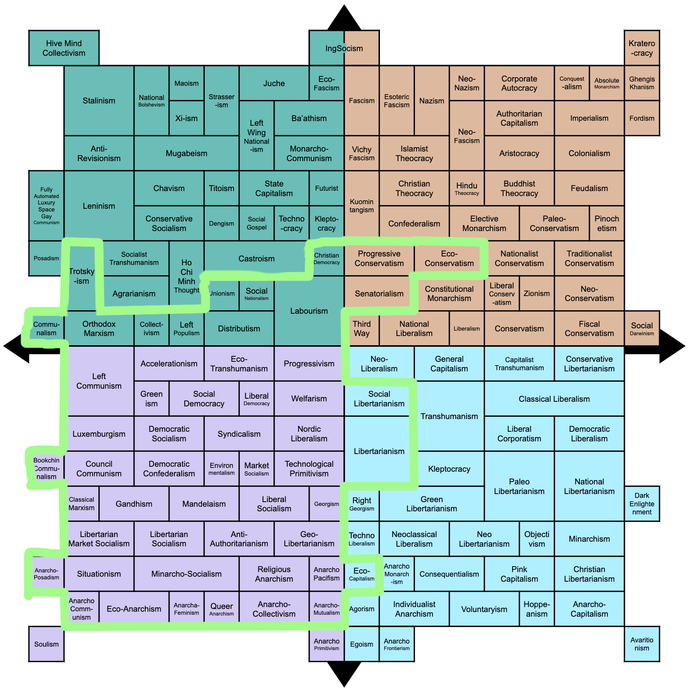
How much political difference are you willing to tolerate in a romantic partner?
Voted 60 times in total
21 Girls
39 Guys
- A LOT27%8 Girls (38%)8 Guys (21%)
- A LITTLE47%8 Girls (38%)20 Guys (51%)
- NONE AT ALL16%5 Girls (24%)5 Guys (13%)
- NOT SURE10%0 Girls (0%)6 Guys (15%)













































Most Helpful Opinions