 Girl's Behavior
  Guy's Behavior
  Flirting
  Dating
  Relationships
  Fashion & Beauty
  Health & Fitness
  Marriage & Weddings
  Shopping & Gifts
  Technology & Internet
  Break Up & Divorce
  Education & Career
  Entertainment & Arts
  Family & Friends
  Food & Beverage
  Hobbies & Leisure
  Other
Other  Religion & Spirituality
  Society & Politics
  Sports
  Travel
  Trending & News
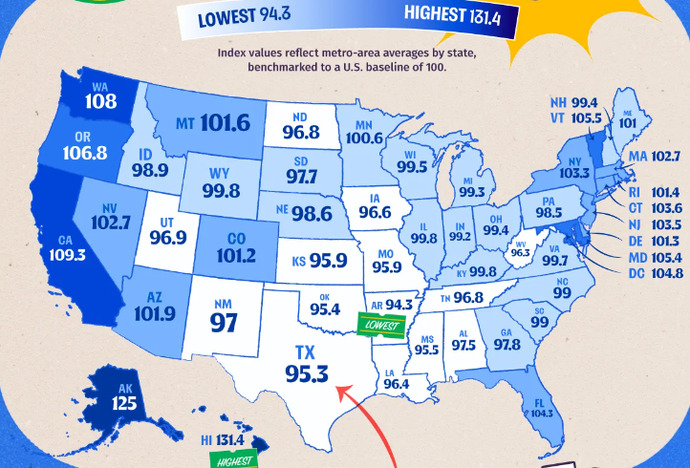
With 100 the average for all 50 US states in 2025, this map shows whether each state is above or below that average, for a specific thing. For example, California's 109.3 means that it is 9.3% above the national average, while Texas's 95.3 means that it is 4.7% below the average..
Can you guess what that thing is?
Updates
3 mo
I'll have the correct answer tomorrow... Friday
Updates
3 mo
The map shows the relative COST OF GROCERIES for each state.
Congratulations to those who got this, or at least got that it had to do with the cost of living.
It's interesting to note that most of the lower numbers are in the middle of the country, where most food is produced, with higher numbers farther away, along the coasts. California is the exception, known for having the highest overall cost of living in the country... for just about everything: food, gasoline, housing, taxes...

Most Helpful Opinions